

Introduction
In the world of trading, understanding market dynamics is crucial for success. One of the most powerful concepts in technical analysis is the identification of support and resistance levels. These levels act as psychological barriers for traders, influencing their decision-making. In this guide, we’ll explore how to draw support and resistance like a pro, enhancing your trading strategy and making you more adept at predicting market movements. With tools like NoroAI.trade, you can elevate your trading game to new heights.
Understanding Support and Resistance

Support and resistance are terms used to describe price points on a chart where the market tends to reverse or stall. Support is a price level where buying interest is strong enough to overcome selling pressure, while resistance is where selling interest overcomes buying pressure. These levels are not always exact and can be better understood as zones.
- Support Levels: Typically identified at prior lows, support levels indicate where the price has previously struggled to drop below.
- Resistance Levels: These are found at prior highs, showing where the price has difficulty breaking above.
Having a solid grasp of these concepts can help you make informed trading decisions. By leveraging platforms like NoroAI.trade, traders can automate their analysis and receive insights to spot these critical levels more efficiently.
How to Identify Support and Resistance Levels

Identifying support and resistance levels involves analyzing historical price data. Here are some effective methods:
- Historical Price Action: Review past price movements to spot previous lows and highs. Look for areas where price oscillated and reversed multiple times.
- Trend Lines: Draw upward or downward sloping lines connecting sequential highs (for resistance) or lows (for support). This visual representation can help identify dynamic support and resistance zones.
- Moving Averages: Utilize moving averages, such as the 50-day or 200-day, as dynamic support or resistance levels. Prices often bounce off these averages, providing additional confirmation.
- Psychological Levels: Round numbers (like 1.2000 in Forex) often serve as psychological support or resistance due to the tendency of traders to place trades around these levels.
By consistently monitoring these indicators, you can gain a better understanding of potential reversal points. Integrating tools like NoroAI.trade into your analysis allows for advanced pattern recognition and data-driven insights to enhance your trading accuracy.
Creating a Support and Resistance Trading Strategy

Once you have identified your support and resistance levels, it’s time to integrate them into a cohesive trading strategy. Here’s how to do it effectively:
- Entry Points: Look to enter trades at or near support levels when bullish, and at or near resistance levels when bearish. Use additional confirmation signals (like candlestick patterns) to validate your entries.
- Stop Loss Placement: Set your stop-loss orders just below support levels in long trades and just above resistance levels in short trades. This maintains a disciplined risk management strategy.
- Target Levels: Use the next resistance level as your target for long trades, and the next support level for short trades. This helps you set realistic profit-taking points.
- Adjusting for Breakouts: If the price breaks through a support or resistance level, consider adjusting your strategy. A breakout can signal a strong trend, and former resistance can become new support, or vice versa.
By following these strategies and continuously analyzing market conditions with tools like NoroAI.trade, traders can make informed decisions that align with market sentiment.
Common Mistakes to Avoid When Drawing Support and Resistance
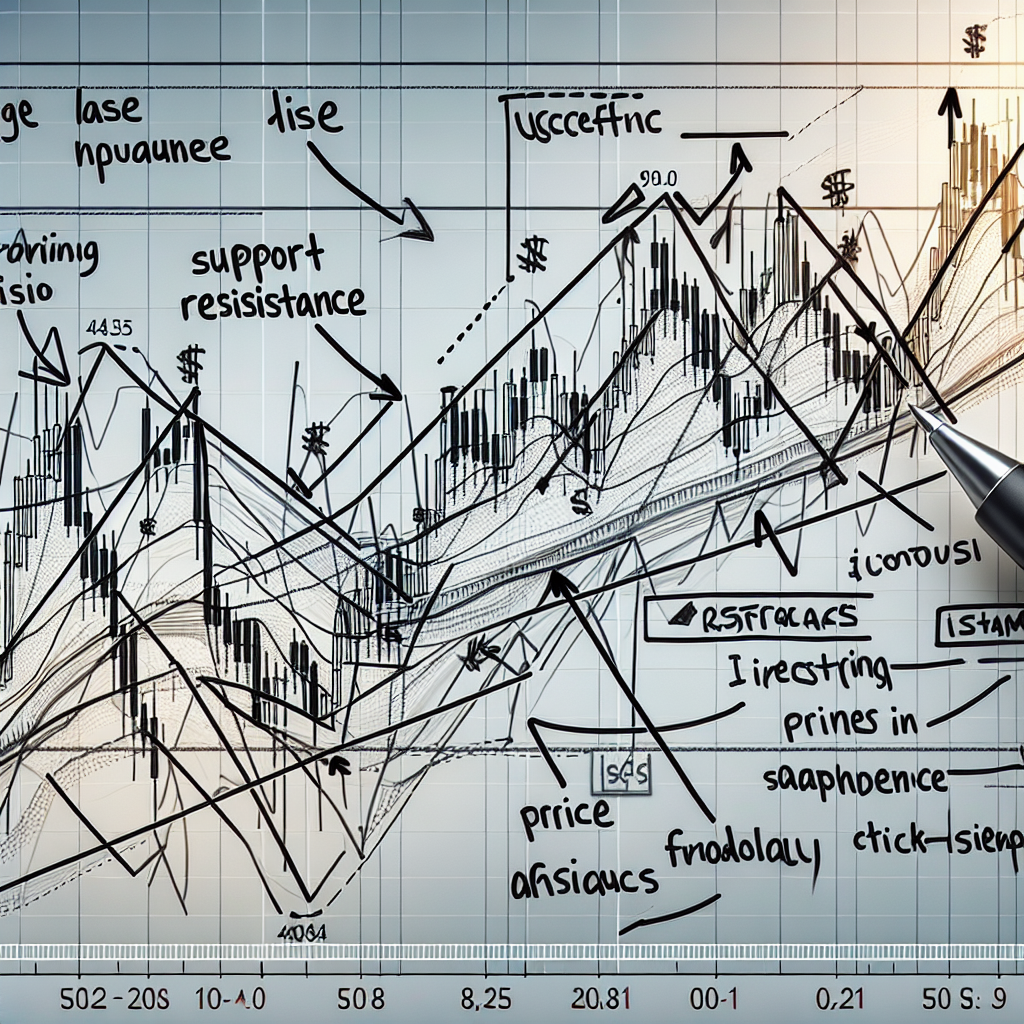
Even experienced traders can falter when identifying support and resistance levels. Here are some common pitfalls to avoid:
- Relying Solely on Historical Levels: While past price action is critical, ignoring current market sentiment can lead to missed opportunities or poor trades.
- Ignoring Volume: Support and resistance levels confirmed by high trading volume are more reliable. Always consider volume when evaluating these levels.
- Drawing Too Many Levels: Overcrowding your charts with too many lines can lead to confusion. Focus on the most significant levels that have been tested multiple times.
- Forgetting to Adjust: Markets are dynamic, and levels can change over time. Regularly update your analysis based on the latest price movements.
By avoiding these mistakes and utilizing advanced tools like NoroAI.trade, traders can refine their approach to support and resistance, ensuring greater accuracy and confidence in their trades.
Conclusion
Drawing support and resistance levels effectively is an essential skill for any trader. By understanding these concepts, employing various identification techniques, and integrating them into your trading strategy, you can enhance your market predictions and decision-making process. Remember, practice is key, and leveraging innovative tools like NoroAI.trade can significantly aid in mastering this skill. Start implementing these techniques today and watch your trading prowess flourish!
Powered by NoroAI.trade – your ultimate trading assistant for smarter decisions.
—